My plan was to write a quick post explaining how I figured out the source of my app’s memory leak; however, I’ve run into two problems: 1) I think my app actually has a few other minor leaks, so I didn’t fix it completely and 2) the “Allocations” instrument in the latest Xcode beta is absolutely refusing to work now, so I can’t recreate what I saw the other day and take screenshots. As soon as I’m done writing this, I’m going to file a radar because I was able to reproduce the crash using Apple’s own sample game, DemoBots.
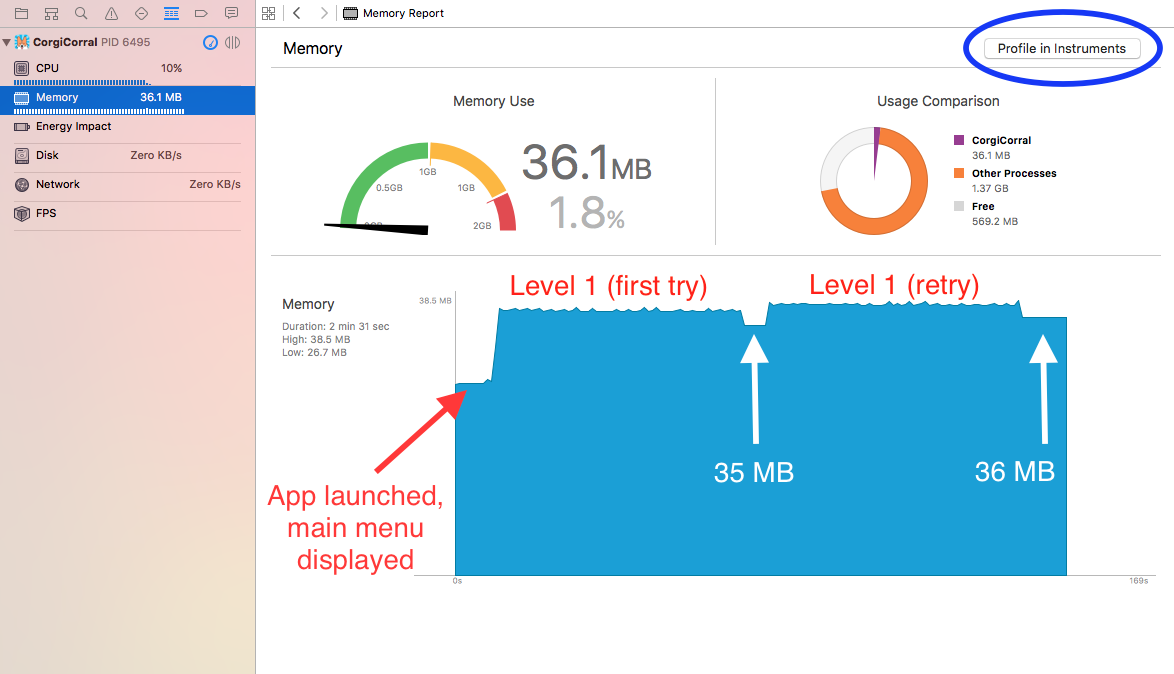
Anyway, there are still a couple things I can show you. First, I ran Corgi Corral on my iPhone 6S and played the same level twice. In between levels, the app transitions to another view controller that gives a summary of your score. As you can see, the second time I played the level the app used more memory than before. Each time I hit “retry,” it increased ever so slightly.
If I hit the “Profile in Instruments” button during gameplay, my app would immediately crash (which is why I’m filing a radar). However, for awhile I was able to get the “Allocations” tool to collect data on the score summary screen. Now, I can only get it to run on the main menu without crashing.
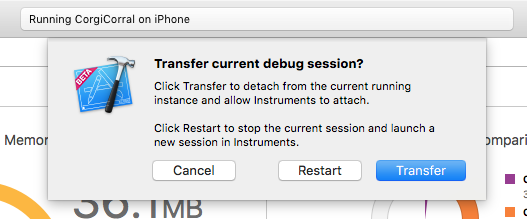
For what it’s worth, it doesn’t matter whether I select “transfer” or “restart” — the app still crashes, except on the main menu, where I can at least show you what the memory-analyzing tool looks like when it’s running:
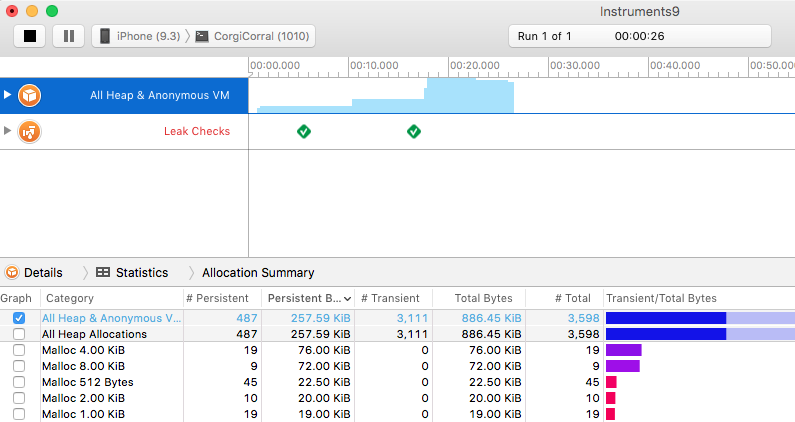
See those little green checkmarks next to “Leak Checks”? When I reached my score summary screen, those were showing up as red icons with an “x” in the middle. When I clicked the red icon, it showed me a list of objects that weren’t being deallocated. The list included many instances of “GKAgent2D,” “GKGoal,” “GKBehavior,” “GKComponentSystem”—enough instances to cover the number of sheep in the level. Evidently, even though the SKSpriteNodes were being removed from the scene (and their agents from the scene’s agent system) when the sheep entered the pen, their GameplayKit agents were refusing to die.
I’m hoping that the next beta of Xcode 7.3 will fix my profiling problem, because I’ve become really interested in learning how to analyze my game’s performance! I’m sure there are many more problems to be found and optimizations to be made. For now, I’m off to file a bug report!